FitTrack — Fitness App
Track Better. Feel Stronger.
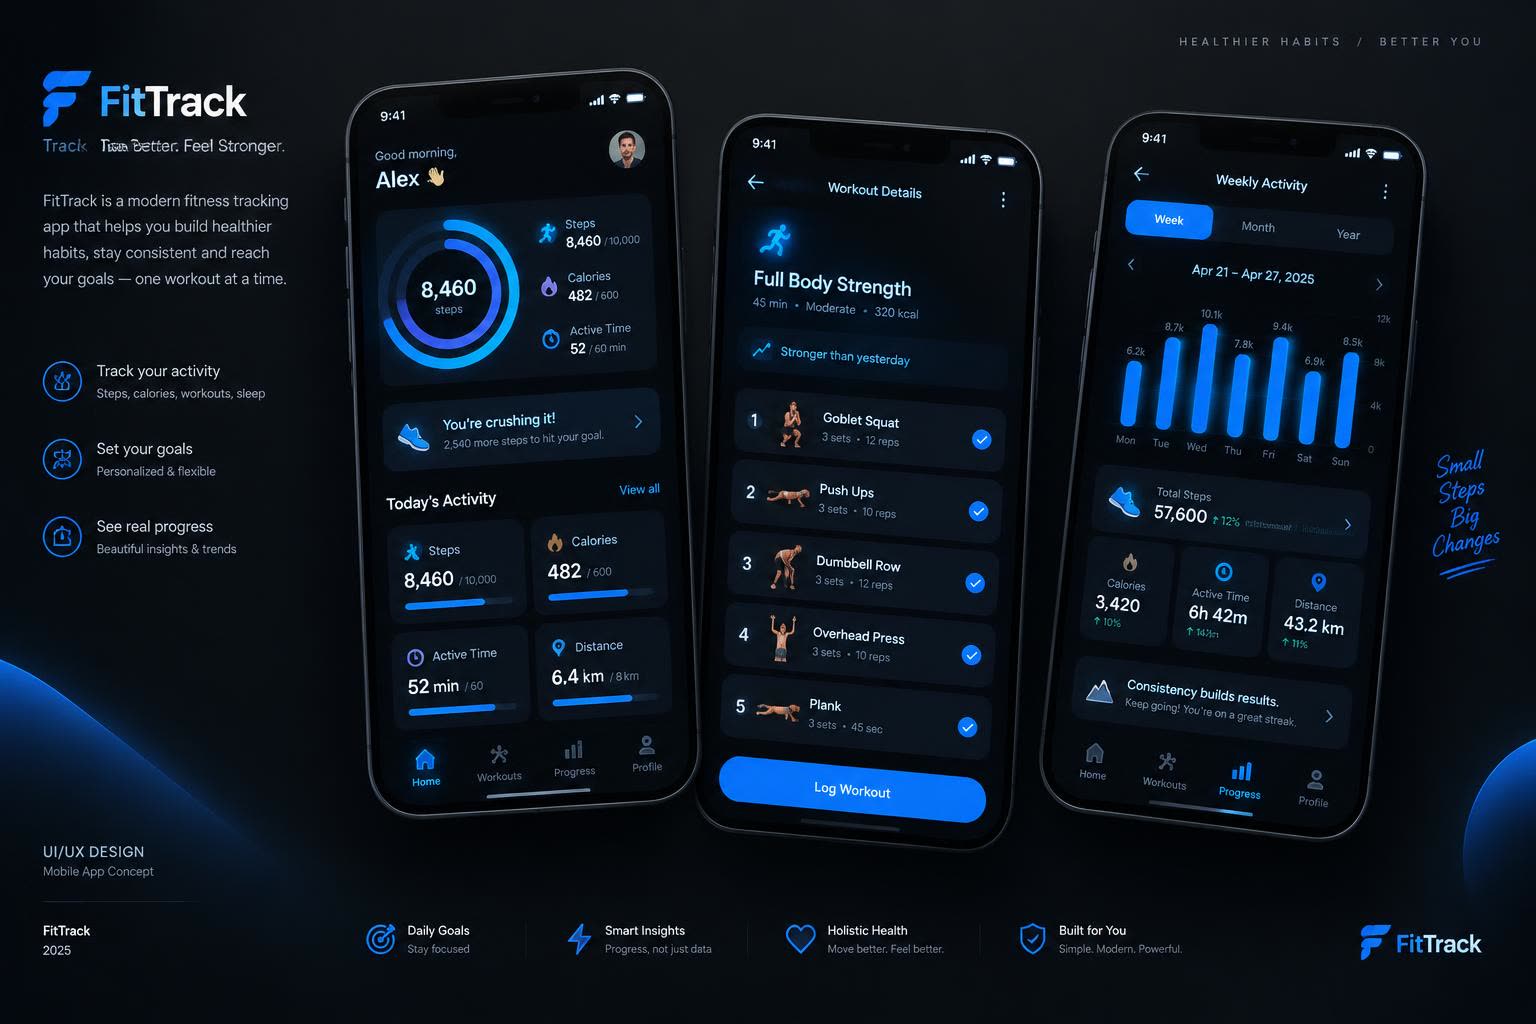
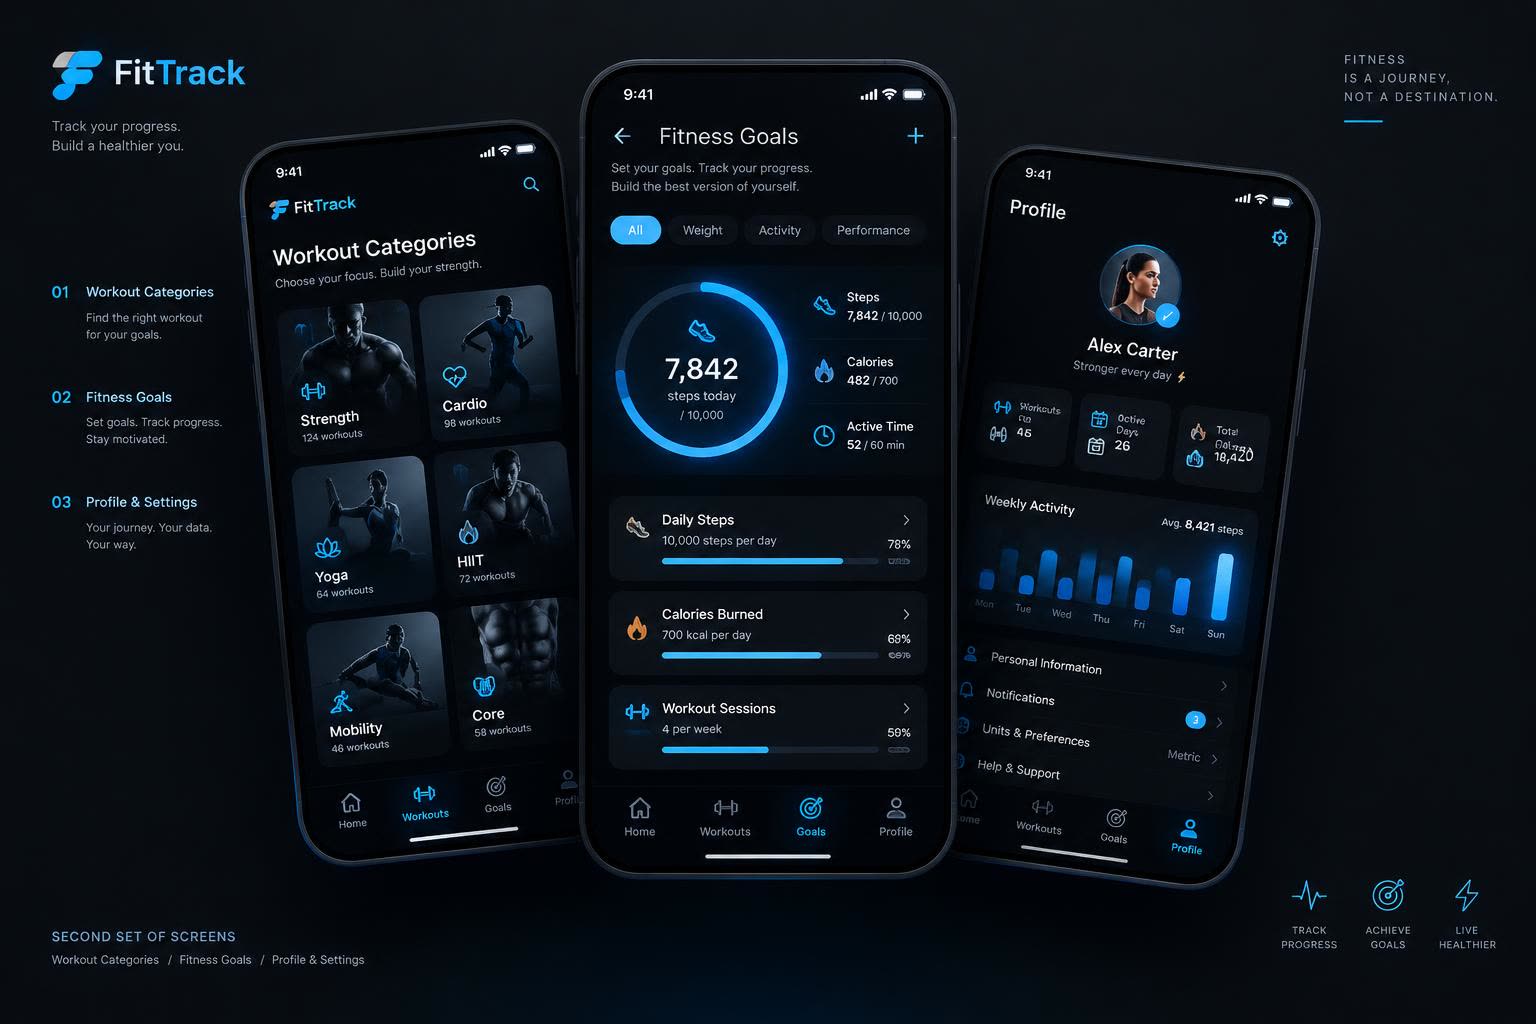
FitTrack is a concept for a premium fitness and workout tracking app. It turns daily activity, workouts and goals into clear, motivating visuals: a dashboard with activity rings, workout categories and exercise details, weekly activity charts, goal tracking with progress indicators, and a profile with personal stats and settings.
What this design sets out to do
- Make progress feel rewarding — every screen answers 'how am I doing?' in seconds.
- Present dense fitness data without clutter through rings, bars and clear hierarchy.
- Keep the dark theme energetic, not gloomy, with electric-blue highlights.
- Reduce workout logging to a single prominent action.
Who it's designed for
Regular gym-goers
Follow structured workouts and want sets, reps and rest clearly laid out mid-session.
Casual movers
Care about steps, calories and streaks — motivation comes from seeing consistency.
Goal-driven athletes
Set weekly targets and track trends over months, so charts and history need real depth.
The screens, end to end
Key flows from the concept, presented as coordinated design boards.
Colors that carry the brand
Electric Blue
#2E9BFF
Deep Navy
#0A1622
Card Navy
#122433
Cyan Glow
#6FD3FF
Flame Orange
#FF7A45
Ice White
#EAF4FF
Type that stays out of the way
Inter
Aa Bb Cc Dd Ee Ff Gg · 0123456789
Large, bold numerals for stats — steps, calories and minutes are the heroes. Supporting labels stay small and muted so the data visualisation does the talking.
Why it works the way it does
Rings for today, bars for the week
Activity rings show daily completion at a glance; bar charts handle trends. Mixing the two keeps each view simple instead of one chart doing everything.
One glowing primary button
'Log Workout' is the only fully filled blue button on the workout screen — mid-session, users shouldn't have to think about what to press.
Dark UI for the gym context
The app is used in bright gyms and at night. A dark surface with high-contrast blue data stays readable in both and feels premium.
Goals as progress bars, not just numbers
Each goal shows percentage completion visually, so '78% of my step goal' is understood instantly without reading the digits.
UI/UX Design Concept · Created to demonstrate design skills · Not a client project